Full operational visibility before problems escalate
IDEA gives superintendents real-time visibility into operational issues. Leadership sees trends across facilities, IT, safety, and incidents instead of waiting for manual reports.
Why executive teams choose IDEA
Everything leadership needs — nothing they don't
IDEA gives superintendents and executive leaders the operational truth behind every site, team, and workflow — without manual report preparation or after-the-fact summaries.
Performance Across Every Site
Track operational performance across every school or site — response, resolution, backlog, and recurring issues at a glance.
Early Signal on Recurring Issues
Identify recurring facility, IT, and safety issues before they escalate into disruptions, claims, or board-level concerns.
Defensible Board Reporting
Support board reporting with clear, defensible metrics drawn directly from operational activity — not manual spreadsheets.
Accountability Without Micromanagement
Improve accountability without micromanaging staff. Every issue has clear ownership, status, and history.
Safety, Maintenance, and Readiness — Connected
Connect safety, maintenance, and operational readiness in one system — so leadership always sees the full picture.
Built for how executive teams actually work
From report to resolution — every step, one system
IDEA connects every stage of operational work — from the moment an issue is reported to the moment it is resolved, documented, and ready for board review. Every department, every site, one operational picture.
What type of report
are you submitting?
- HazardUnsafe conditions and immediate risks
- SecurityThreat or access control risk
- IncidentPolicy violations or regulatory issues
- InfrastructureSafety devices, grounds, or utilities
- PolicyViolations, policy creation or review
- ITComputers, software, network, or data access
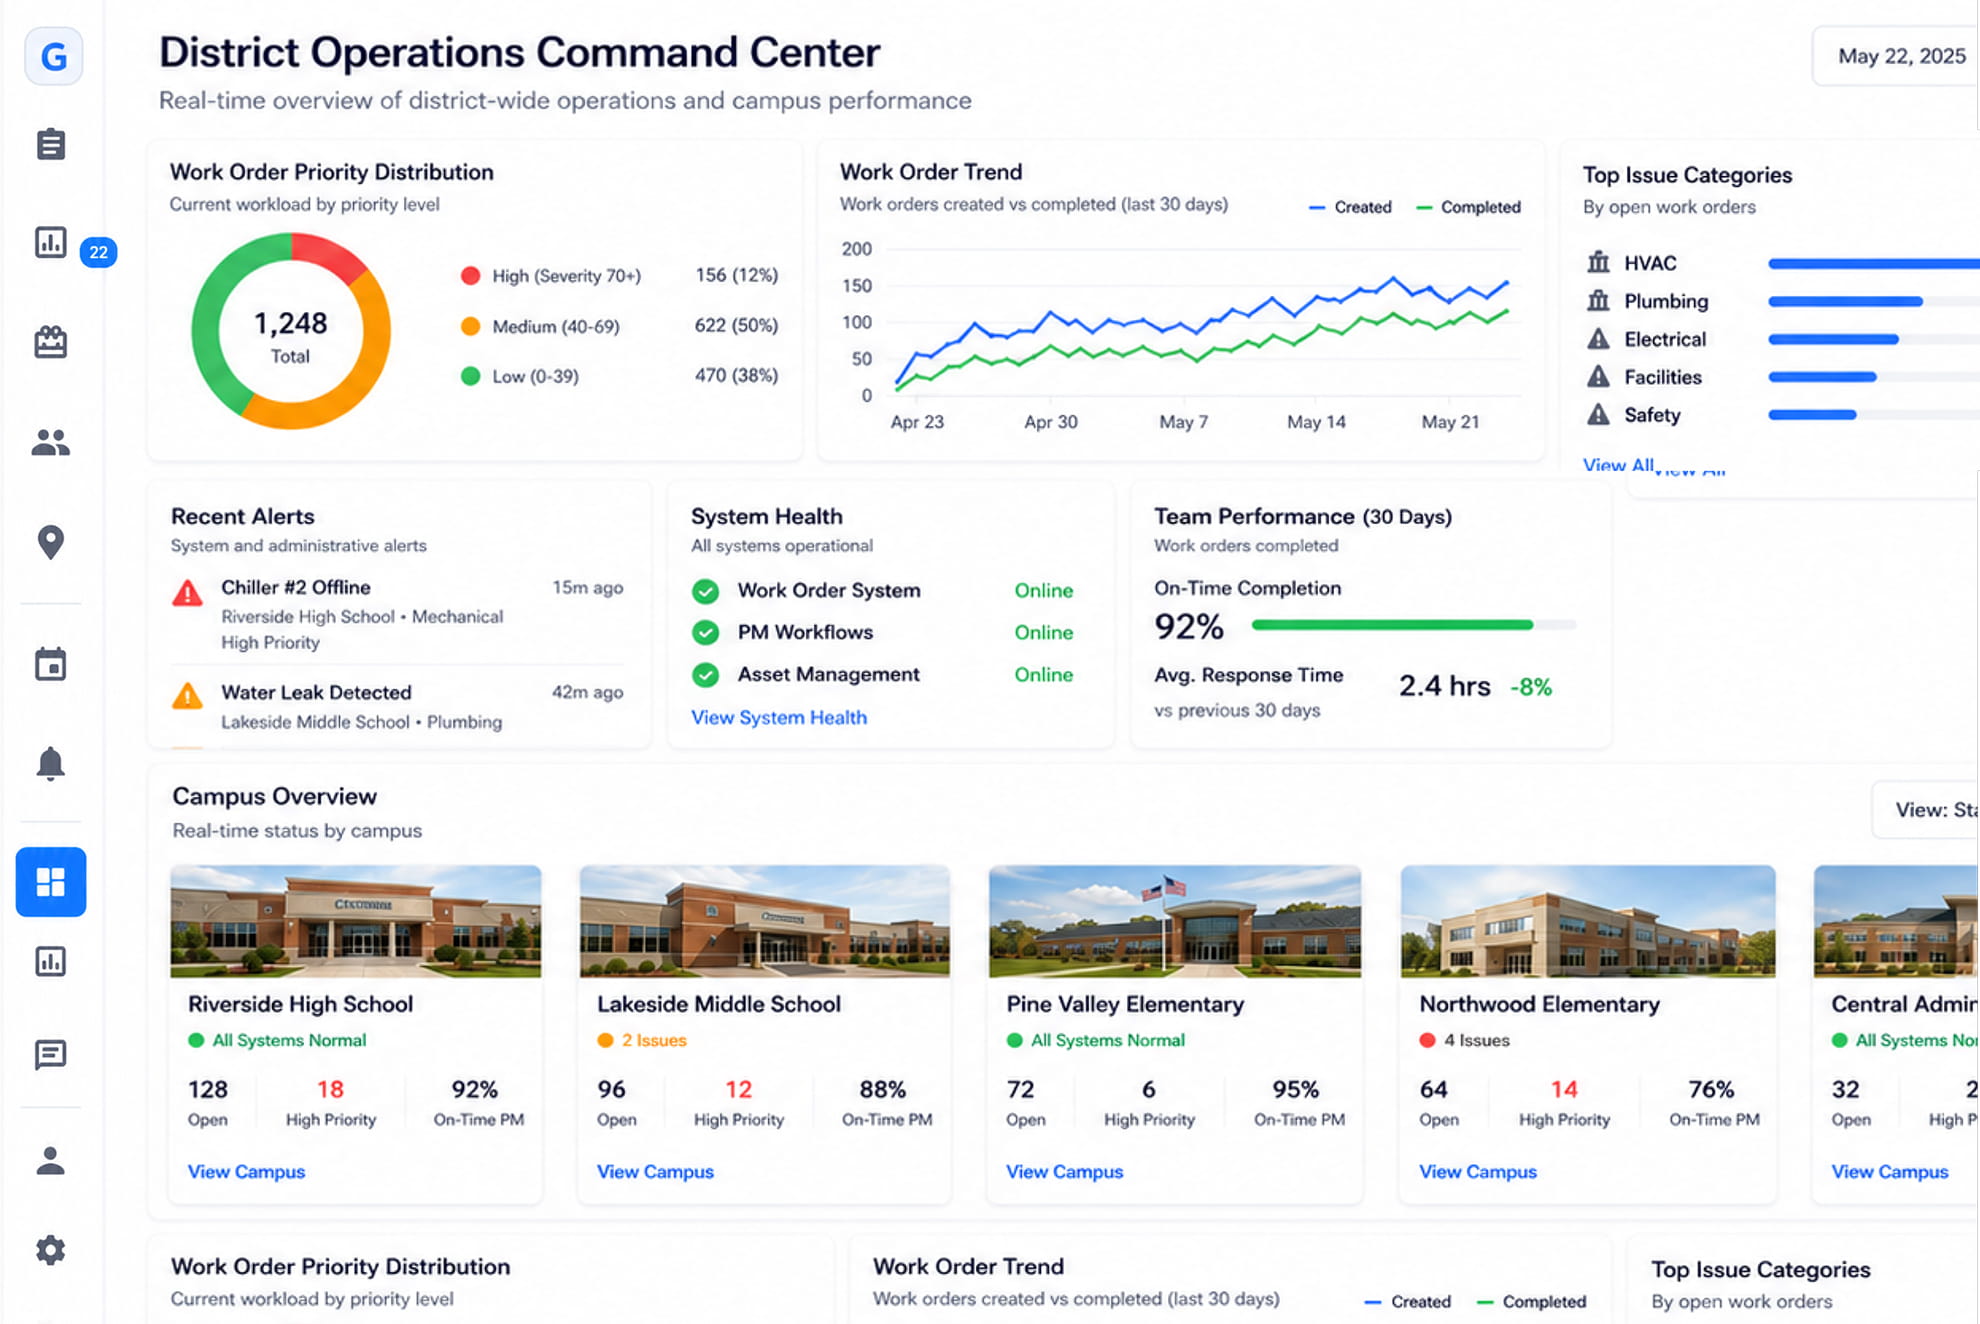
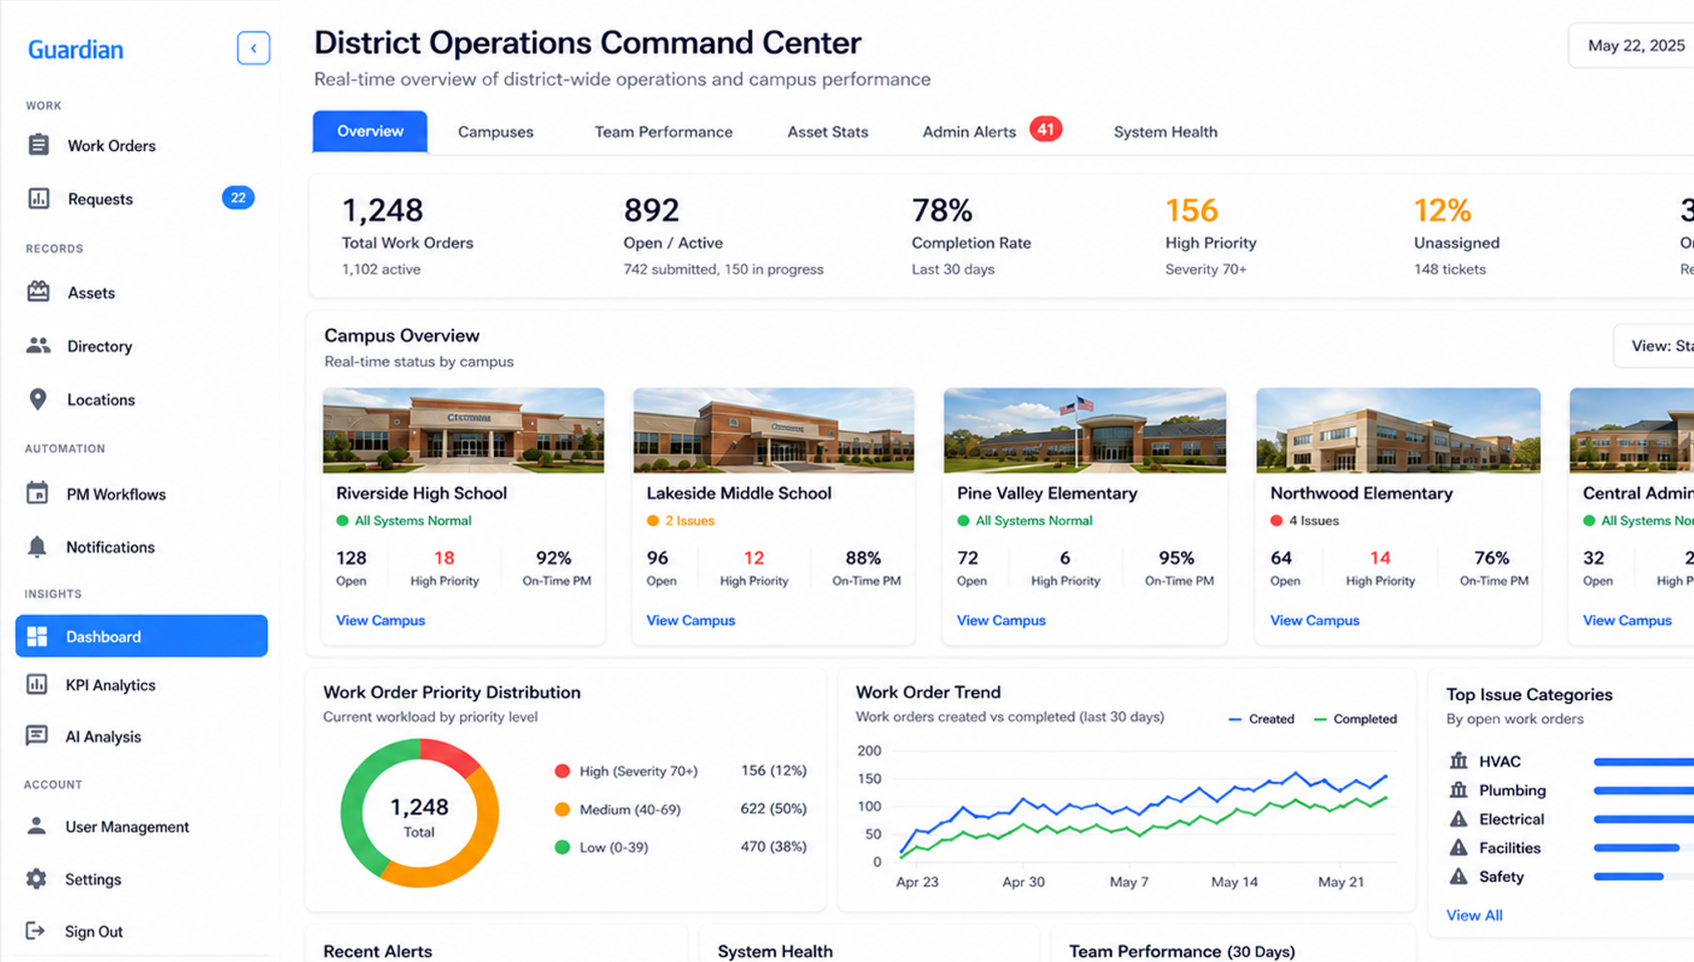
Real-time operational visibility
Entire operation at a glance
The executive dashboard gives superintendents and leaders a live view of open work, response performance, recurring issues, safety trends, and risk activity — without waiting for a manual report.
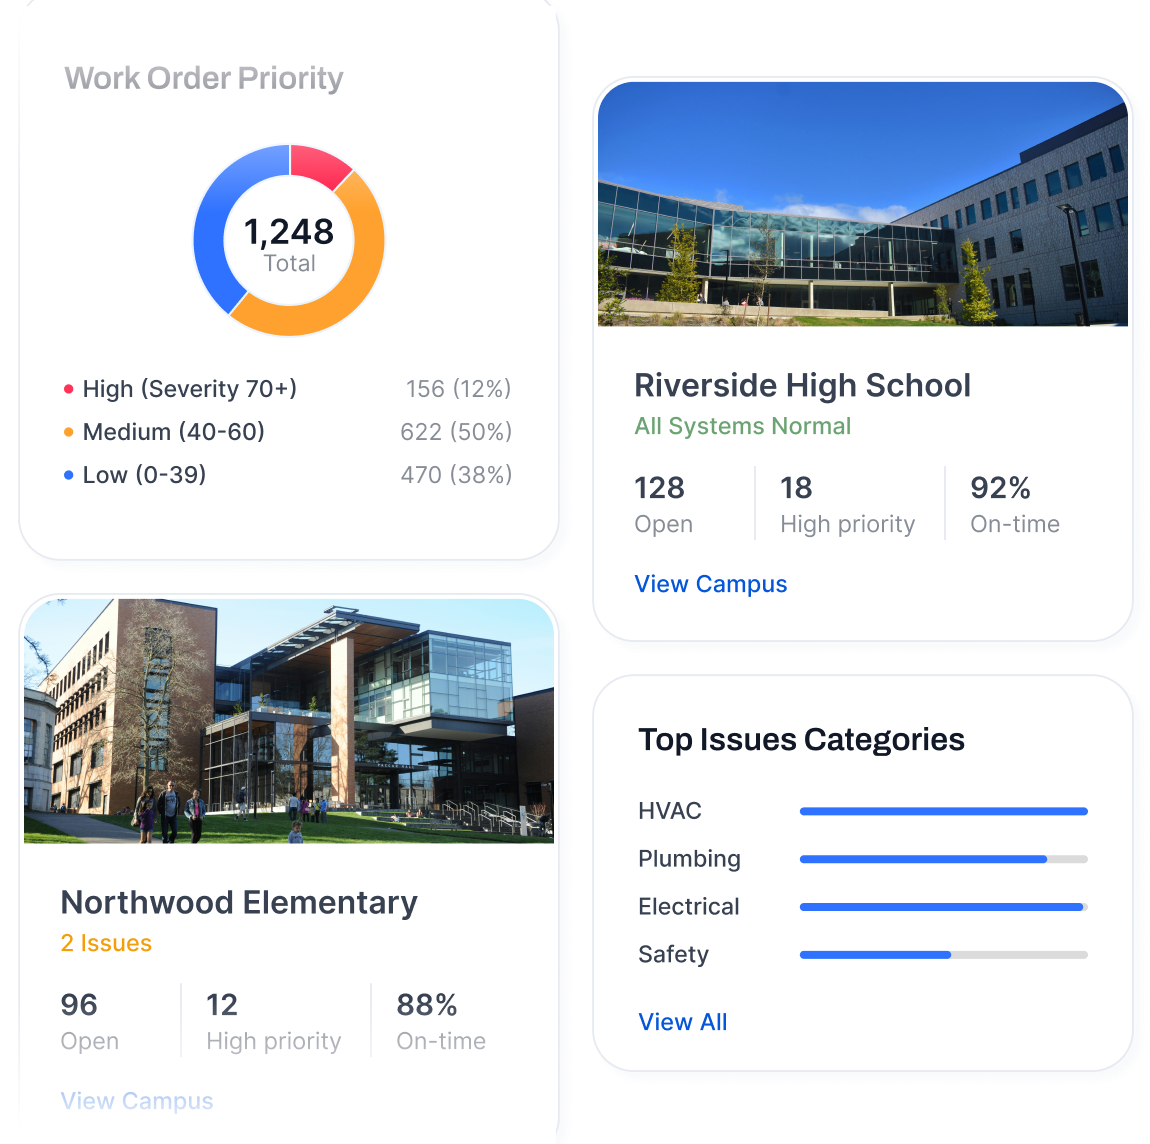
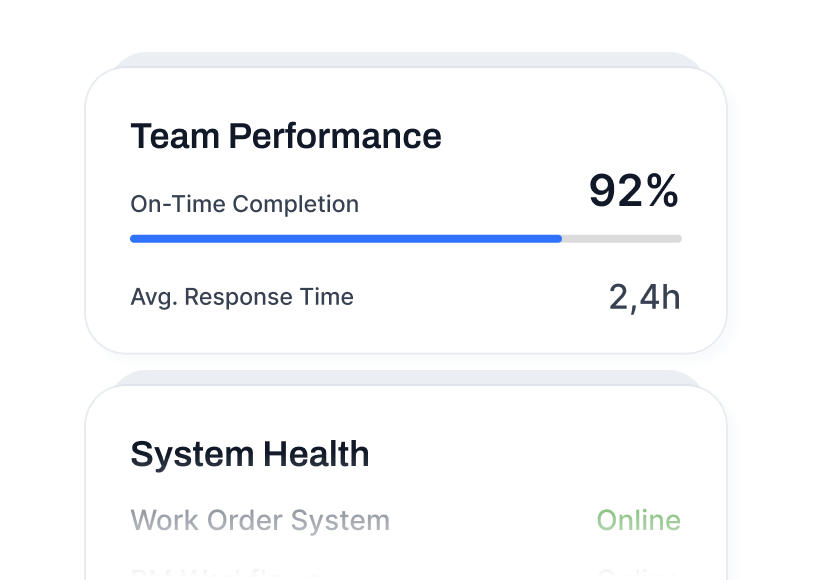
Performance Across Every Site
Live view of response time, resolution rate, backlog, and aging work across every school or location.
Recurring Issue & Risk Trends
Surface buildings, systems, or workflows with repeated problems before they become escalations.
Board-ready KPIs
Cost avoidance, risk reduction, response performance, and capital planning support — drawn from real activity.
Safety & Incident Visibility
Open hazards, incident trends, repeat locations, and escalated issues across every site in real time.
See the Executive Dashboard
Request a personalized demo and see how IDEA works for executive teams like yours.